dbase
| Date: | 2007-01-19 (last modified), 2007-01-07 (created) |
|---|
NOTE: You may want to use pandas instead of this.
The dbase.py class, can be used to read/write/summarize/plot time-series data.
To summarize the functionality:
- data and variable names stored in a dictionary - accessible using variable names
- load/save from/to csv/pickle format, including date information (shelve format to be added)
- plotting and descriptive statistics, with dates if provided
- adding/deleting variables, including trends/(seasonal)dummies
- selecting observations based on dates or other variable values (e.g., > 1/1/2003)
- copying instance data
Attached also the dbase_pydoc.txt information for the class.
Example Usage
To see the class in action download the file and run it (python dbase.py). This will create an example data file (./dbase_test_files/data.csv) that will be processed by the class.
To import the module:
In [1]:
import sys
sys.path.append('attachments/dbase')
import dbase
After running the class you can load the example data using
In [2]:
data = dbase.dbase("../_static/items/attachments/dbase/data.csv", date = 0)
In the above command '0' is the index of the column containing dates.
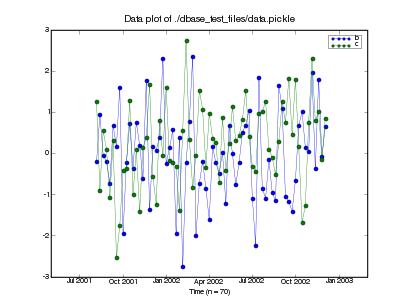
You can plot series 'b' and 'c' in the file using
In [3]:
data.dataplot('b','c')

You get descriptive statistics for series 'a','b', and 'c' by using
In [4]:
data.info('a','b','c')
Section author: VincentNijs
Attachments