xplt
| Date: | 2006-02-02 (last modified), 2006-02-02 (created) |
|---|
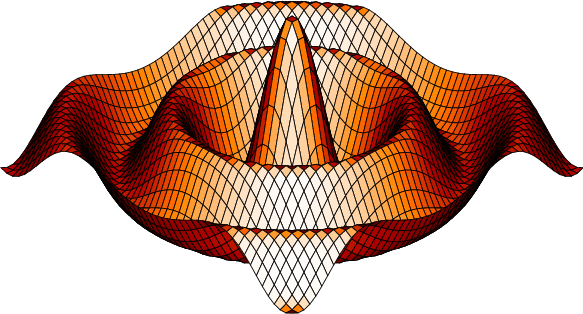
This shows a simple example of how to create a quick 3-d surface visualization using xplt.
In [ ]:
from scipy.sandbox import xplt
from numpy import *
from scipy import special

x,y = ogrid[-12:12:50j,-12:12:50j]
r = sqrt(x**2+y**2)
z = special.j0(r)
xplt.surf(z,x,y,shade=1,palette='heat')
Section author: TravisOliphant
Attachments