Mayavi: examples
| Date: | 2017-07-13 (last modified), 2006-06-19 (created) |
|---|
||\<#80FF80> This page presents scripting Mayavi2 using the advanced, object-oriented API. Mayavi2 has recently acquired an easy-to-use, thought maybe not as powerful, scripting module: mlab. You are invited to refer to the section of Mayavi2 user guide. ||
Introduction
Here, you will be presented some examples of rendering scenes you can get with !MayaVi2. You are advised to read [:Cookbook/MayaVi/ScriptingMayavi2] to understand what you see, although most examples given here are self-explanatory.
||\<#FF8080> Please note that these examples are not up to date. The example gallery for the latest version of Mayavi can be found at http://enthought.github.com/mayavi/mayavi/auto/examples.html. ||
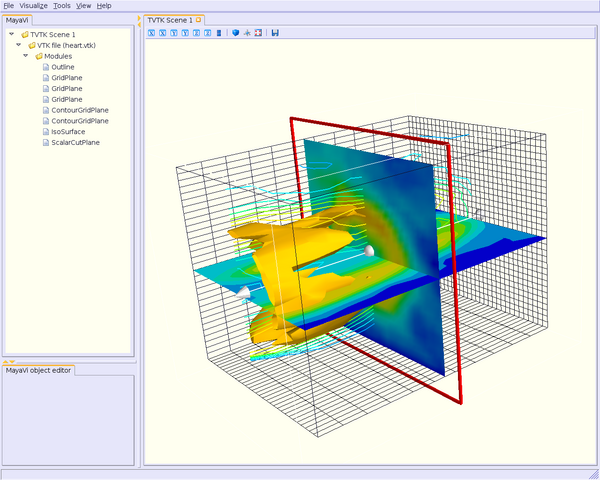
Example using IsoSurface Module (contour.py)
#!/usr/bin/env mayavi2

"""This script demonstrates how one can script MayaVi and use its
contour related modules.  Notice the magic line at the top.
"""
# Author: Prabhu Ramachandran <prabhu_r@users.sf.net>
# Copyright (c) 2005-2007, Enthought, Inc.
# License: BSD Style.

# Standard library imports
from os.path import join, dirname

# Enthought library imports
import enthought.mayavi
from enthought.mayavi.sources.vtk_file_reader import VTKFileReader
from enthought.mayavi.filters.threshold import Threshold
from enthought.mayavi.modules.outline import Outline
from enthought.mayavi.modules.grid_plane import GridPlane
from enthought.mayavi.modules.contour_grid_plane import ContourGridPlane
from enthought.mayavi.modules.iso_surface import IsoSurface
from enthought.mayavi.modules.scalar_cut_plane import ScalarCutPlane


def contour():
    """The script itself.  We needn't have defined a function but
    having a function makes this more reusable.
    """
    # 'mayavi' is always defined on the interpreter.
    # Create a new scene.
    mayavi.new_scene()

    # Read a VTK (old style) data file.
    r = VTKFileReader()
    r.initialize(join(dirname(enthought.mayavi.__file__),
                      'examples', 'data', 'heart.vtk'))
    mayavi.add_source(r)

    # Create an outline for the data.
    o = Outline()
    mayavi.add_module(o)

    # Create three simple grid plane modules.
    # First normal to 'x' axis.
    gp = GridPlane()
    mayavi.add_module(gp)
    # Second normal to 'y' axis.
    gp = GridPlane()
    mayavi.add_module(gp)
    gp.grid_plane.axis = 'y'
    # Third normal to 'z' axis.
    gp = GridPlane()
    mayavi.add_module(gp)
    gp.grid_plane.axis = 'z'

    # Create one ContourGridPlane normal to the 'x' axis.
    cgp = ContourGridPlane()
    mayavi.add_module(cgp)
    # Set the position to the middle of the data.
    cgp.grid_plane.position = 15

    # Another with filled contours normal to 'y' axis.
    cgp = ContourGridPlane()
    mayavi.add_module(cgp)
    # Set the axis and position to the middle of the data.
    cgp.grid_plane.axis = 'y'
    cgp.grid_plane.position = 15
    cgp.contour.filled_contours = True

    # An isosurface module.
    iso = IsoSurface(compute_normals=True)
    mayavi.add_module(iso)
    iso.contour.contours = [220.0]

    # An interactive scalar cut plane.
    cp = ScalarCutPlane()
    mayavi.add_module(cp)
    cp.implicit_plane.normal = 0,0,1


if __name__ == '__main__':
    contour()
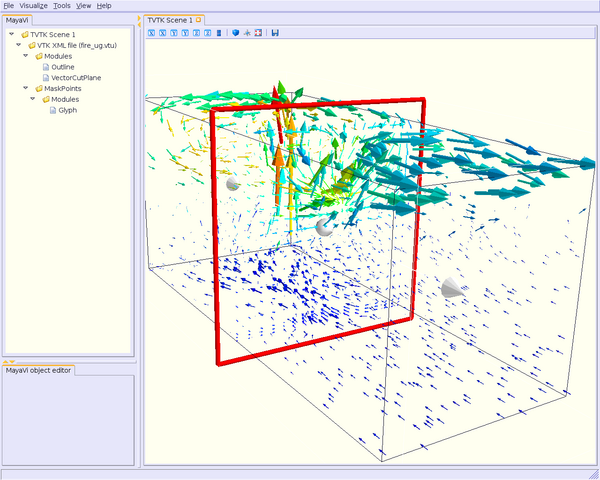
Example using Glyph Module (glyph.py)
#!/usr/bin/env mayavi2

"""This script demonstrates the use of a VectorCutPlane, splitting the
pipeline using a MaskPoints filter and then viewing the filtered data
with the Glyph module.
"""
# Author: Prabhu Ramachandran <prabhu_r@users.sf.net>
# Copyright (c) 2005-2007, Enthought, Inc.
# License: BSD Style.

# Standard library imports
from os.path import join, dirname

# Enthought library imports
import enthought.mayavi
from enthought.mayavi.sources.vtk_xml_file_reader import VTKXMLFileReader
from enthought.mayavi.modules.outline import Outline
from enthought.mayavi.modules.glyph import Glyph
from enthought.mayavi.modules.vector_cut_plane import VectorCutPlane
from enthought.mayavi.modules.vectors import Vectors
from enthought.mayavi.filters.mask_points import MaskPoints


def glyph():
    """The script itself.  We needn't have defined a function but
    having a function makes this more reusable.
    """
    # 'mayavi' is always defined on the interpreter.
    # Create a new VTK scene.
    mayavi.new_scene()

    # Read a VTK (old style) data file.
    r = VTKXMLFileReader()
    r.initialize(join(dirname(enthought.mayavi.__file__),
                      'examples', 'data', 'fire_ug.vtu'))
    mayavi.add_source(r)

    # Create an outline and a vector cut plane.
    mayavi.add_module(Outline())

    v = VectorCutPlane()
    mayavi.add_module(v)
    v.glyph.color_mode = 'color_by_scalar'

    # Now mask the points and show glyphs (we could also use
    # Vectors but glyphs are a bit more generic)
    m = MaskPoints()
    m.filter.set(on_ratio=10, random_mode=True)
    mayavi.add_filter(m)

    g = Glyph()
    mayavi.add_module(g)
    # Note that this adds the module to the filtered output.
    g.glyph.scale_mode = 'scale_by_vector'
    # Use arrows to view the scalars.
    g.glyph.glyph_source = g.glyph.glyph_list[1]


if __name__ == '__main__':
    glyph()
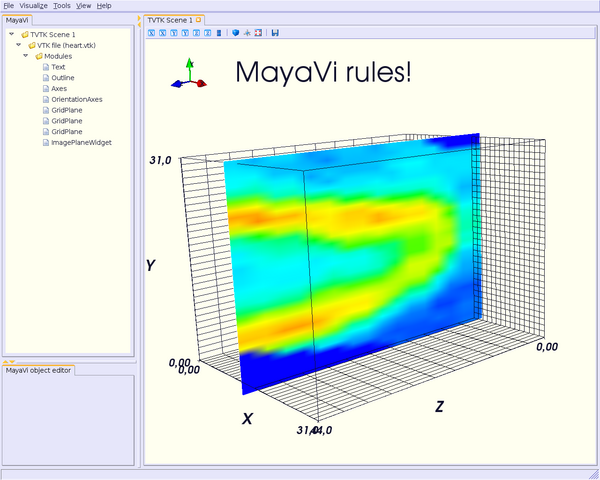
Example without Mayavi2 UI (nongui.py)
#!/usr/bin/env python

"""This script demonstrates how one can use the MayaVi framework
without displaying MayaVi's UI.  Note: look at the end of this file to
see how the non gui plugin is chosen instead of the default gui
mayavi plugin.

"""
# Author: Prabhu Ramachandran <prabhu_r@users.sf.net>
# Copyright (c) 2005, Enthought, Inc.
# License: BSD Style.

# On systems with multiple wx installations installed, pick one that works
# with the libraries Mayavi depends on.
try:
    import wxversion
    wxversion.ensureMinimal('2.6')
except ImportError:
    pass

# Standard library imports
import sys
from os.path import join, dirname

# Enthought library imports
from enthought.mayavi.app import Mayavi, NONGUI_PLUGIN_DEFINITIONS


class MyApp(Mayavi):
    def run(self):
        """This is executed once the application GUI has started.
        *Make sure all other MayaVi specific imports are made here!*
        """

        # Various imports to do different things.
        from enthought.mayavi.sources.vtk_file_reader import VTKFileReader
        from enthought.mayavi.modules.outline import Outline
        from enthought.mayavi.modules.axes import Axes
        from enthought.mayavi.modules.grid_plane import GridPlane
        from enthought.mayavi.modules.image_plane_widget import ImagePlaneWidget
        from enthought.mayavi.modules.text import Text
        from enthought.mayavi.modules.contour_grid_plane import ContourGridPlane
        from enthought.mayavi.modules.iso_surface import IsoSurface

        script = self.script

        # Create a new scene.
        script.new_scene()

        # Read a VTK (old style) data file.
        r = VTKFileReader()
        r.initialize('data/heart.vtk')
        r.initialize(join(dirname(__file__), 'data', 'heart.vtk'))
        script.add_source(r)

        # Put up some text.
        t = Text(text='MayaVi rules!', x_position=0.2, y_position=0.9, width=0.8)
        t.property.color = 1, 1, 0  # Bright yellow, yeah!
        script.add_module(t)

        # Create an outline for the data.
        o = Outline()
        script.add_module(o)

        # Create an axes for the data.
        a = Axes()
        script.add_module(a)

        # Create three simple grid plane modules.
        # First normal to 'x' axis.
        gp = GridPlane()
        script.add_module(gp)
        # Second normal to 'y' axis.
        gp = GridPlane()
        gp.grid_plane.axis = 'y'
        script.add_module(gp)
        # Third normal to 'z' axis.
        gp = GridPlane()
        script.add_module(gp)
        gp.grid_plane.axis = 'z'

        # Create one ImagePlaneWidget.
        ipw = ImagePlaneWidget()
        script.add_module(ipw)
        # Set the position to the middle of the data.
        ipw.ipw.slice_position = 16

        # Create one ContourGridPlane normal to the 'x' axis.
        cgp = ContourGridPlane()
        script.add_module(cgp)
        # Set the position to the middle of the data.
        cgp.grid_plane.axis = 'y'
        cgp.grid_plane.position = 15

        # An isosurface module.
        iso = IsoSurface(compute_normals=True)
        script.add_module(iso)
        iso.contour.contours = [200.0]

        # Set the view.
        s = script.engine.current_scene
        cam = s.scene.camera
        cam.azimuth(45)
        cam.elevation(15)
        s.render()


if __name__ == '__main__':
    m = MyApp()
    # Note how we change the plugins that are loaded only here.
    m.main(plugin_defs=NONGUI_PLUGIN_DEFINITIONS)

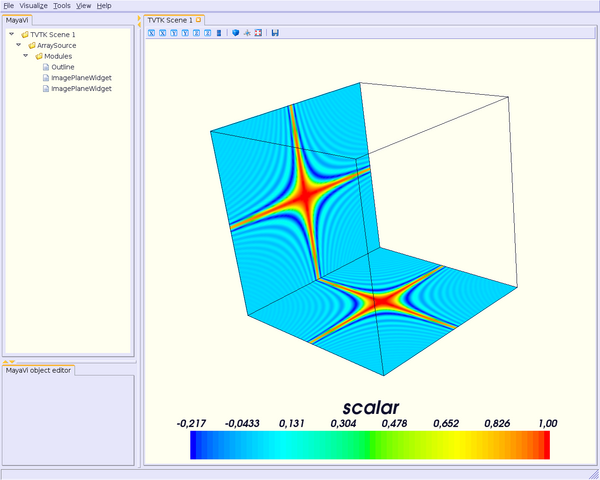
Example with a 3D array as numerical source (numeric_source.py)
#!/usr/bin/env mayavi2

"""This script demonstrates how to create a numpy array data and
visualize it as image data using a few modules.

"""
# Author: Prabhu Ramachandran <prabhu_r@users.sf.net>
# Copyright (c) 2005-2007, Enthought, Inc.
# License: BSD Style.

# Standard library imports
import enthought.util.scipyx as scipy

# Enthought library imports
from enthought.mayavi.sources.array_source import ArraySource
from enthought.mayavi.modules.outline import Outline
from enthought.mayavi.modules.image_plane_widget import ImagePlaneWidget


def make_data(dims=(128, 128, 128)):
    """Creates some simple array data of the given dimensions to test
    with."""
    np = dims[0]*dims[1]*dims[2]

    # Create some scalars to render.
    x, y, z = scipy.ogrid[-5:5:dims[0]*1j,-5:5:dims[1]*1j,-5:5:dims[2]*1j]
    x = x.astype('f')
    y = y.astype('f')
    z = z.astype('f')

    scalars = (scipy.sin(x*y*z)/(x*y*z))
    return scipy.transpose(scalars).copy() # This makes the data contiguous.


def view_numpy():
    """Example showing how to view a 3D numpy array in mayavi2.
    """
    # 'mayavi' is always defined on the interpreter.
    mayavi.new_scene()
    # Make the data and add it to the pipeline.
    data = make_data()
    src = ArraySource(transpose_input_array=False)
    src.scalar_data = data
    mayavi.add_source(src)
    # Visualize the data.
    o = Outline()
    mayavi.add_module(o)
    ipw = ImagePlaneWidget()
    mayavi.add_module(ipw)
    ipw.module_manager.scalar_lut_manager.show_scalar_bar = True

    ipw_y = ImagePlaneWidget()
    mayavi.add_module(ipw_y)
    ipw_y.ipw.plane_orientation = 'y_axes'


if __name__ == '__main__':
    view_numpy()

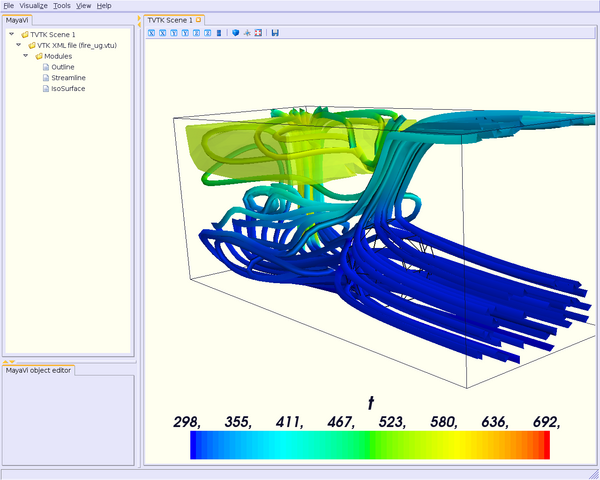
Example using Streamline Module (streamline.py)
#!/usr/bin/env mayavi2
"""This script demonstrates how one can script MayaVi to display
streamlines and an iso surface.
"""
# Author: Prabhu Ramachandran <prabhu_r@users.sf.net>
# Copyright (c) 2005-2007, Enthought, Inc.
# License: BSD Style.

# Standard library imports
from os.path import join, dirname

# Enthought library imports
from enthought.mayavi.sources.vtk_xml_file_reader import VTKXMLFileReader
from enthought.mayavi.modules.outline import Outline
from enthought.mayavi.modules.streamline import Streamline
from enthought.mayavi.modules.iso_surface import IsoSurface


def setup_data(fname):
    """Given a VTK XML file name `fname`, this creates a mayavi2
    reader for it and adds it to the pipeline.  It returns the reader
    created.
    """
    mayavi.new_scene()
    r = VTKXMLFileReader()
    r.initialize(fname)
    mayavi.add_source(r)
    return r

def streamline():
    """Sets up the mayavi pipeline for the visualization.
    """
    # Create an outline for the data.
    o = Outline()
    mayavi.add_module(o)

    s = Streamline(streamline_type='tube')
    mayavi.add_module(s)
    s.stream_tracer.integration_direction = 'both'
    s.seed.widget.center = 3.5, 0.625, 1.25
    s.module_manager.scalar_lut_manager.show_scalar_bar = True

    i = IsoSurface()
    mayavi.add_module(i)
    i.contour.contours[0] = 550
    i.actor.property.opacity = 0.5


if __name__ == '__main__':
    import enthought.mayavi
    fname = join(dirname(enthought.mayavi.__file__),
                 'examples', 'data', 'fire_ug.vtu')
    r = setup_data(fname)
    streamline()

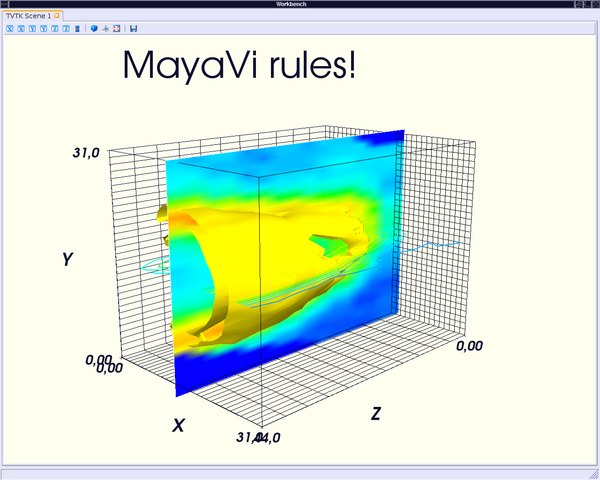
Example using ImagePlaneWidget Module (test.py)
#!/usr/bin/env python

"""This script demonstrates how one can script MayaVi, set its size,
create a new VTK scene and create a few simple modules.

"""
# Author: Prabhu Ramachandran <prabhu_r@users.sf.net>
# Copyright (c) 2005, Enthought, Inc.
# License: BSD Style.

# On systems with multiple wx installations installed, pick one that works
# with the libraries Mayavi depends on.
try:
    import wxversion
    wxversion.ensureMinimal('2.6')
except ImportError:
    pass

# Standard library imports
import sys
from os.path import join, dirname

# Enthought library imports
from enthought.mayavi.app import Mayavi


class MyApp(Mayavi):
    def run(self):
        """This is executed once the application GUI has started.
        *Make sure all other MayaVi specific imports are made here!*
        """
        # Various imports to do different things.
        from enthought.mayavi.sources.vtk_file_reader import VTKFileReader
        from enthought.mayavi.filters.threshold import Threshold
        from enthought.mayavi.modules.outline import Outline
        from enthought.mayavi.modules.axes import Axes
        from enthought.mayavi.modules.grid_plane import GridPlane
        from enthought.mayavi.modules.image_plane_widget import ImagePlaneWidget
        from enthought.mayavi.modules.text import Text

        script = self.script
        # Create a new scene.
        script.new_scene()

        # Read a VTK (old style) data file.
        r = VTKFileReader()
        r.initialize(join(dirname(__file__), 'data', 'heart.vtk'))
        script.add_source(r)

        # Put up some text.
        t = Text(text='MayaVi rules!', x_position=0.2,
                 y_position=0.9, width=0.8)
        t.property.color = 1, 1, 0  # Bright yellow, yeah!
        script.add_module(t)

        # Create an outline for the data.
        o = Outline()
        script.add_module(o)

        # Create an axes for the data.
        a = Axes()
        script.add_module(a)

        # Create an orientation axes for the scene.  This only works with
        # VTK-4.5 and above which is why we have the try block.
        try:
            from enthought.mayavi.modules.orientation_axes import OrientationAxes
        except ImportError:
            pass
        else:
            a = OrientationAxes()
            a.marker.set_viewport(0.0, 0.8, 0.2, 1.0)
            script.add_module(a)

        # Create three simple grid plane modules.
        # First normal to 'x' axis.
        gp = GridPlane()
        script.add_module(gp)
        # Second normal to 'y' axis.
        gp = GridPlane()
        gp.grid_plane.axis = 'y'
        script.add_module(gp)
        # Third normal to 'z' axis.
        gp = GridPlane()
        script.add_module(gp)
        gp.grid_plane.axis = 'z'

        # Create one ImagePlaneWidget.
        ipw = ImagePlaneWidget()
        script.add_module(ipw)
        # Set the position to the middle of the data.
        ipw.ipw.slice_position = 16


if __name__ == '__main__':
    a = MyApp()
    a.main()
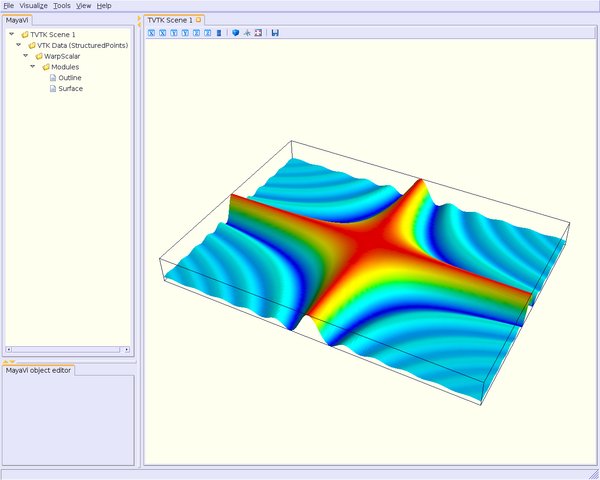
Example using mlab (surf_regular_mlab.py)
See also [:Cookbook/MayaVi/Surf] for another way of doing this.
#!/usr/bin/env mayavi2
"""Shows how to view data created by `enthought.tvtk.tools.mlab` with
mayavi2.
"""

# Author: Prabhu Ramachandran <prabhu@aero.iitb.ac.in>
# Copyright (c) 2006-2007, Enthought Inc.
# License: BSD Style.

import numpy

from enthought.tvtk.tools import mlab
from enthought.mayavi.sources.vtk_data_source import VTKDataSource
from enthought.mayavi.filters.warp_scalar import WarpScalar
from enthought.mayavi.modules.outline import Outline
from enthought.mayavi.modules.surface import Surface


def f(x, y):
    """Some test function.
    """
    return numpy.sin(x*y)/(x*y)

def make_data():
    """Make some test numpy data and create a TVTK data object from it
    that we will visualize.
    """
    x = numpy.arange(-7., 7.05, 0.1)
    y = numpy.arange(-5., 5.05, 0.05)
    s = mlab.SurfRegular(x, y, f)
    return s.data

def add_data(tvtk_data):
    """Add a TVTK data object `tvtk_data` to the mayavi pipleine.
    """
    d = VTKDataSource()
    d.data = tvtk_data
    mayavi.add_source(d)

def surf_regular():
    """Now visualize the data as done in mlab.
    """
    w = WarpScalar()
    mayavi.add_filter(w)
    o = Outline()
    s = Surface()
    mayavi.add_module(o)
    mayavi.add_module(s)


if __name__ == '__main__':
    mayavi.new_scene()
    d = make_data()
    add_data(d)
    surf_regular()
Section author: FredericPetit, Christian Gagnon
Attachments