Mayabi: mlab
| Date: | 2017-07-13 (last modified), 2006-02-21 (created) |
|---|
||\<#80FF80> This page is about the tvtk.tools.mlab module. You are strongly advised to use the more recent mayavi.mlab module which can also be used from ipython -wthread or as a library inside another application.||
The ``mlab.py`` module allows for simple 3D plotting of objects. It provides an object oriented approch to 3d visualization.
It relies on the simple TVTK module, rather than on the full blown Mayavi application. As a result it has less dependencies. However, it is harder to extend and more limited. The developers are not planning any feature addition to this module, and we strongly advise you to use the Mayavi mlab module, which provides the same usecases, but with more functionalities and is under constant development. For more information, you can read the relevant section of the Mayavi user guide
''' Table of Contents '''
A Simple Example
||\<#FF8080> Important: All these examples must be run in "ipython -wthread" or in a Wx application (like pycrust, or the Mayavi2 application). They will not work if you don't use this option.||
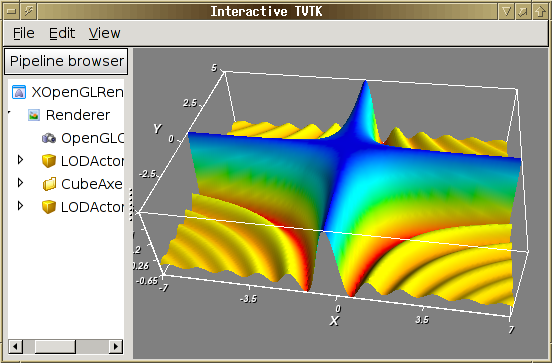
Start with `ipython -wthread` and paste the following code::
import scipy

# prepare some interesting function:
def f(x, y):
    return 3.0*scipy.sin(x*y+1e-4)/(x*y+1e-4)

x = scipy.arange(-7., 7.05, 0.1)
y = scipy.arange(-5., 5.05, 0.1)

# 3D visualization of f:
from enthought.tvtk.tools import mlab
fig = mlab.figure()
s = mlab.SurfRegular(x, y, f)
fig.add(s)
Changing axis and colour
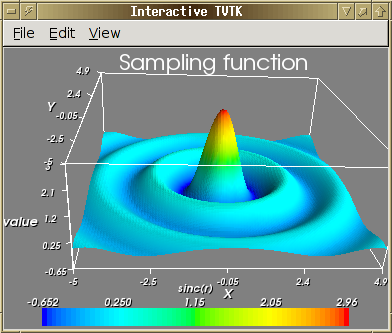
from scipy import *

[x,y]=mgrid[-5:5:0.1,-5:5:0.1]
r=sqrt(x**2+y**2)
z=sin(3*r)/(r)

from enthought.tvtk.tools import mlab

# Open a viewer without the object browser:
f=mlab.figure(browser=False)

s=mlab.Surf(x,y,z,z)
f.add(s)
s.scalar_bar.title='sinc(r)'
s.show_scalar_bar=True
# LUT means "Look-Up Table", it give the mapping between scalar value and color
s.lut_type='blue-red'
# The current figure has two objects, the outline object originaly present,
# and the surf object that we added.
f.objects[0].axis.z_label='value'
t=mlab.Title()
t.text='Sampling function'
f.add(t)
# Edit the title properties with the GUI:
t.edit_traits()

List of different functionalities
The implementation provided here is object oriented and each visualization capability is implemented as a class that has traits. So each of these may be configured. Each visualization class derives (ultimately) from MLabBase which is responsible for adding/removing its actors into the render window. The classes all require that the RenderWindow be a `pyface.tvtk.scene.Scene` instance (this constraint can be relaxed if necessary later on).
This module offers the following broad class of functionality:
*Figure\
This basically manages all of the objects rendered. Just like\
figure in any Matlab like environment. A convenience function\
called `figure` may be used to create a nice Figure instance.
*Glyphs\
This and its subclasses let one place glyphs at points specified\
as inputs. The subclasses are: `Arrows`, `Cones`, `Cubes`,\
`Cylinders`, `Spheres`, and `Points`.
*Line3\
Draws lines between the points specified at initialization time.
*Outline\
Draws an outline for the contained objects.
*Title\
Draws a title for the entire figure.
*LUTBase\
Manages a lookup table and a scalar bar (legend) for it. This\
is subclassed by all classes that need a LUT.
*SurfRegular\
MayaVi1's imv.surf like functionality that plots surfaces given x (1D), y(1D)\
and z (or a callable) arrays.
*SurfRegularC\
Also plots contour lines.
*TriMesh\
Given triangle connectivity and points, plots a mesh of them.
*FancyTriMesh\
Plots the mesh using tubes and spheres so its fancier.
*Mesh\
Given x, y generated from scipy.mgrid, and a z to go with it. Along with optional\
scalars. This class builds the triangle connectivity (assuming that x, y are from\
scipy.mgrid) and builds a mesh and shows it.
*FancyMesh\
Like mesh but shows the mesh using tubes and spheres.
*Surf\
This generates a surface mesh just like Mesh but renders the mesh as\
a surface.
*Contour3\
Shows contour for a mesh.
*ImShow\
Allows one to view large numeric arrays as image data using an image\
actor. This is just like MayaVi1's `mayavi.tools.imv.viewi`.
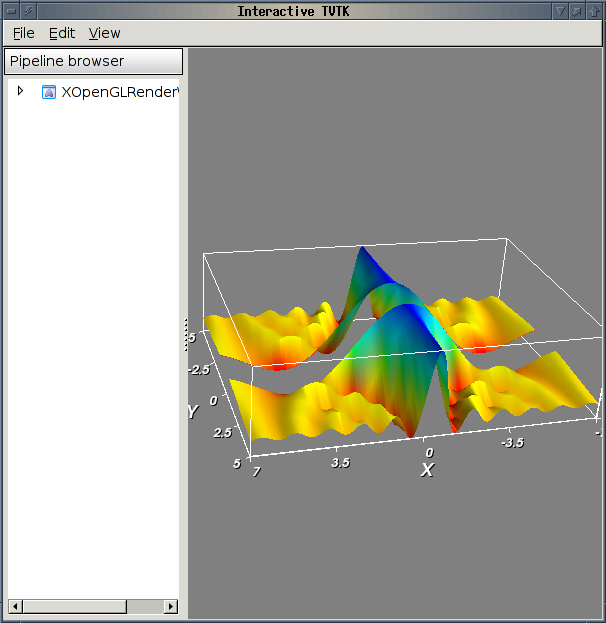
To see nice examples of all of these look at the `test_*` functions at the end of this file. Here is a quick example that uses these test functions:
from enthought.tvtk.tools import mlab
f = mlab.figure()
mlab.test_surf(f) # Create a spherical harmonic.
f.pop() # Remove it.
mlab.test_molecule(f) # Show a caffeine molecule.
f.renwin.reset_zoom() # Scale the view.
f.pop() # Remove this.
mlab.test_lines(f) # Show pretty lines.
f.clear() # Remove all the stuff on screen.
Section author: ArndBaecker, GaelVaroquaux, Christian Gagnon
Attachments