Optimization and fit demo
| Date: | 2017-07-13 (last modified), 2006-02-10 (created) |
|---|
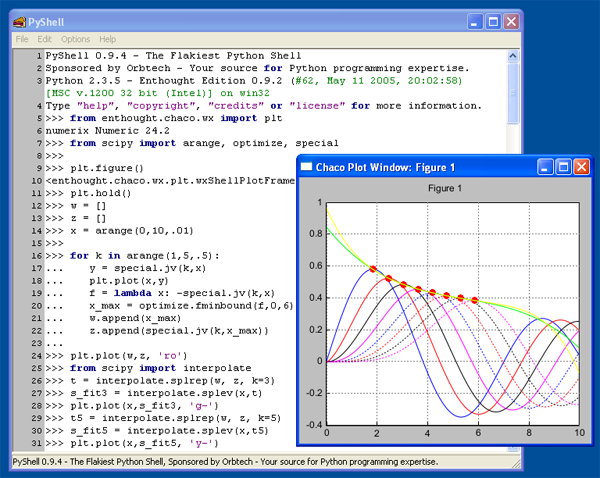
This is a quick example of creating data from several Bessel functions and finding local maxima, then fitting a curve using some spline functions from the scipy.interpolate module. The enthought.chaco package and wxpython are used for creating the plot. PyCrust (which comes with wxpython) was used as the python shell.
In [ ]:
from enthought.chaco.wx import plt
from scipy import arange, optimize, special

plt.figure()
plt.hold()
w = []
z = []
x = arange(0,10,.01)

for k in arange(1,5,.5):
   y = special.jv(k,x)
   plt.plot(x,y)
   f = lambda x: -special.jv(k,x)
   x_max = optimize.fminbound(f,0,6)
   w.append(x_max)
   z.append(special.jv(k,x_max))

plt.plot(w,z, 'ro')
from scipy import interpolate
t = interpolate.splrep(w, z, k=3)
s_fit3 = interpolate.splev(x,t)
plt.plot(x,s_fit3, 'g-')
t5 = interpolate.splrep(w, z, k=5)
s_fit5 = interpolate.splev(x,t5)
plt.plot(x,s_fit5, 'y-')
In [ ]:
#class left
# 
Optimization Example
Section author: SciPyDotOrg, Unknown[1], Unknown[133], PauliVirtanen, Christian Gagnon
Attachments