Matplotlib: mplot3d
| Date: | 2010-03-30 (last modified), 2006-02-17 (created) |
|---|
The examples below show simple 3D plots using matplotlib. matplotlib's 3D capabilities were added by incorporating John Porter's mplot3d module, thus no additional download is required any more, the following examples will run with an up to date matplotlib installation. '''Note, this code is not supported in the matplotlib-0.98 branch, but you can use either the latest 0.99 release or the 0.91 maintenance version if you need this functionality. ''' Alternatively, the Mayavi2 project provides a pylab-like API for extensive 3D plotting: http://code.enthought.com/projects/mayavi/docs/development/html/mayavi/mlab.html
Note that not all examples on this page are up to date, so some of them might not be working. For other examples, see http://matplotlib.sourceforge.net/examples/mplot3d/
3D Plotting examples:
#!python
from numpy import *
import pylab as p
#import matplotlib.axes3d as p3
import mpl_toolkits.mplot3d.axes3d as p3

# u and v are parametric variables.
# u is an array from 0 to 2*pi, with 100 elements
u=r_[0:2*pi:100j]
# v is an array from 0 to 2*pi, with 100 elements
v=r_[0:pi:100j]
# x, y, and z are the coordinates of the points for plotting
# each is arranged in a 100x100 array
x=10*outer(cos(u),sin(v))
y=10*outer(sin(u),sin(v))
z=10*outer(ones(size(u)),cos(v))
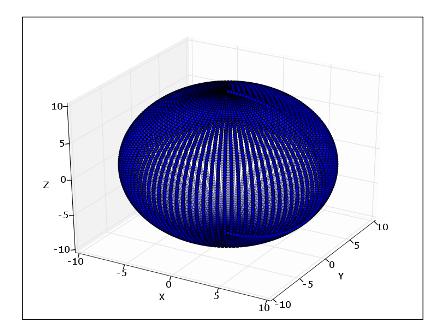
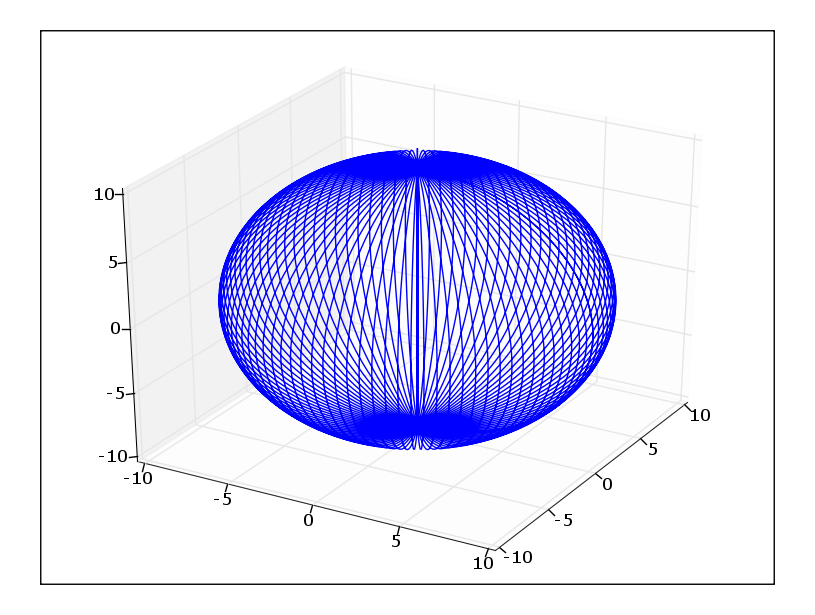
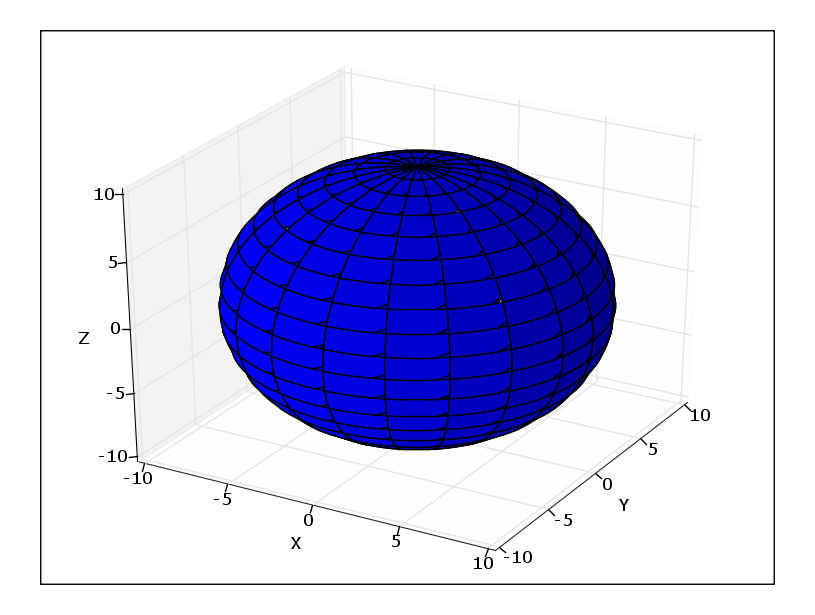
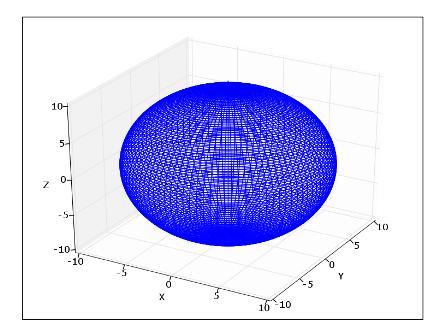
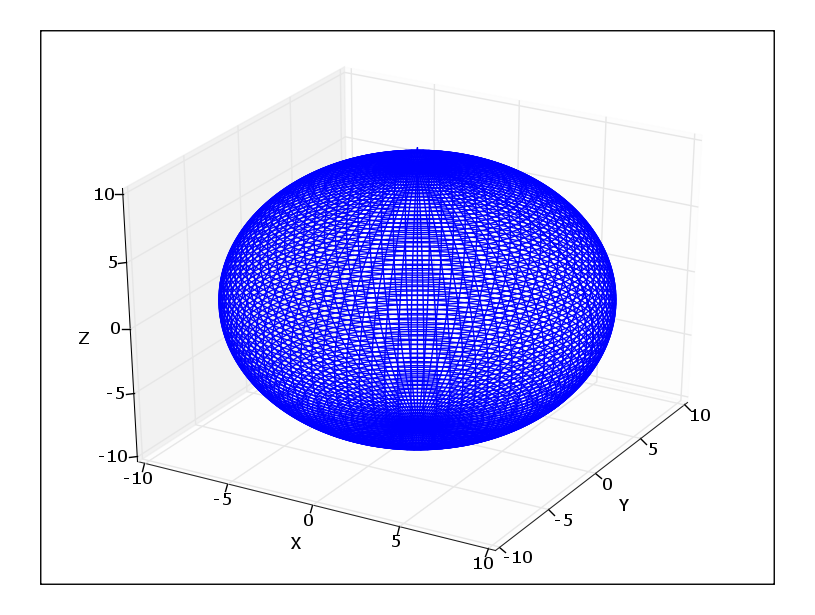
Wireframe (works on 0.87.5):
#!python
fig=p.figure()
ax = p3.Axes3D(fig)
ax.plot_wireframe(x,y,z)
ax.set_xlabel('X')
ax.set_ylabel('Y')
ax.set_zlabel('Z')
p.show()

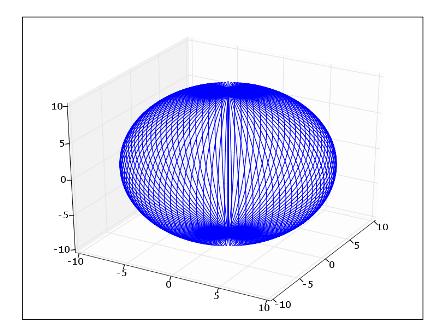
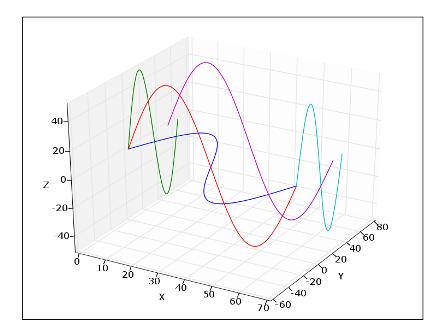
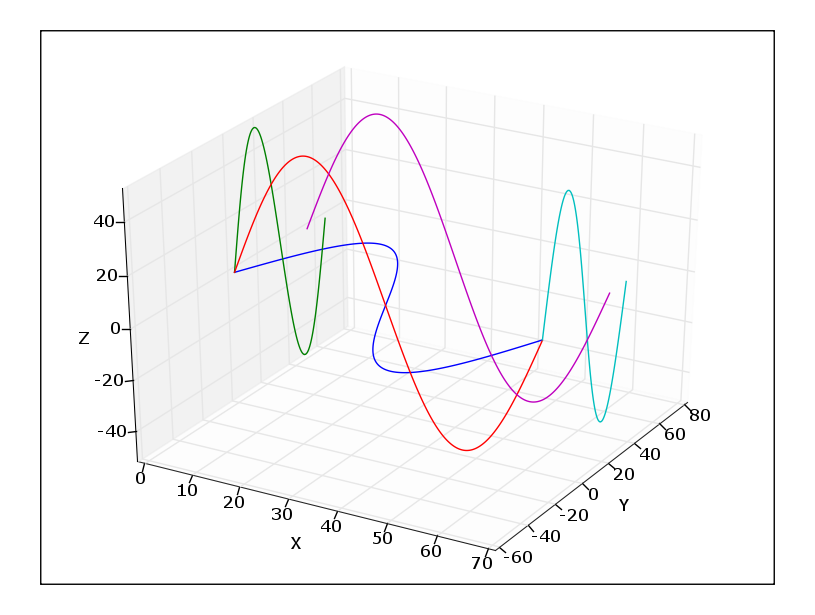
3D Plot:
#!python
# this connects each of the points with lines
fig=p.figure()
ax = p3.Axes3D(fig)
# plot3D requires a 1D array for x, y, and z
# ravel() converts the 100x100 array into a 1x10000 array
ax.plot3D(ravel(x),ravel(y),ravel(z))
ax.set_xlabel('X')
ax.set_ylabel('Y')
ax.set_zlabel('Z')
fig.add_axes(ax)
p.show()

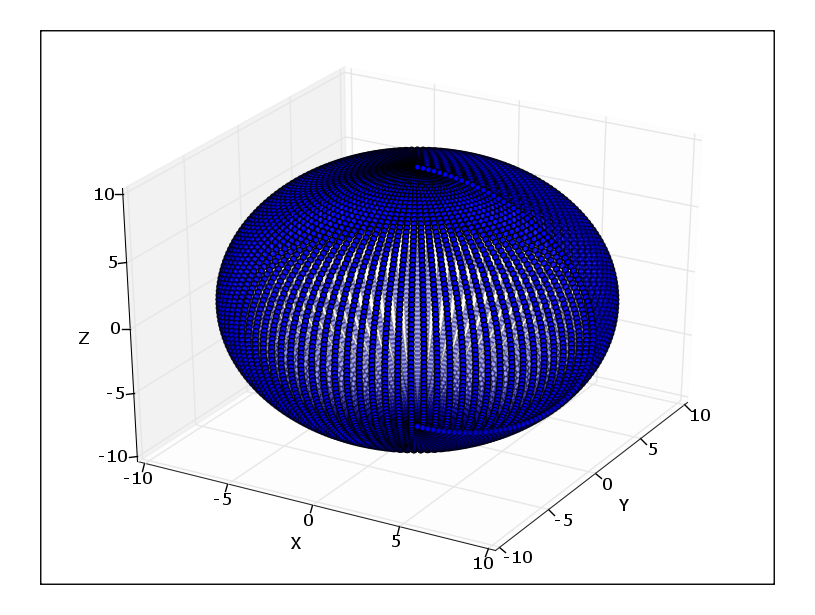
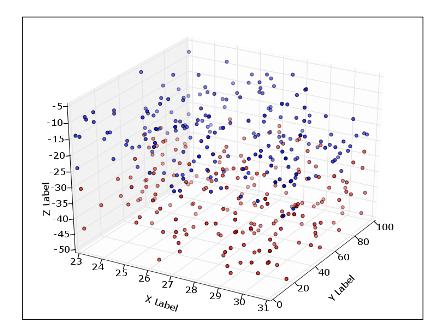
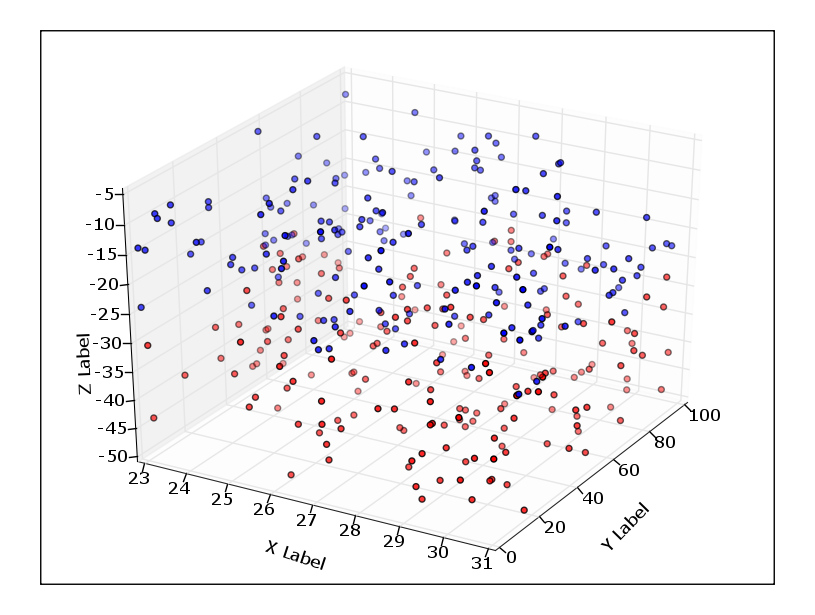
Scatter (works on 0.87.5, shows some artefacts):
#!python
fig=p.figure()
ax = p3.Axes3D(fig)
# scatter3D requires a 1D array for x, y, and z
# ravel() converts the 100x100 array into a 1x10000 array
ax.scatter3D(ravel(x),ravel(y),ravel(z))
ax.set_xlabel('X')
ax.set_ylabel('Y')
ax.set_zlabel('Z')
p.show()
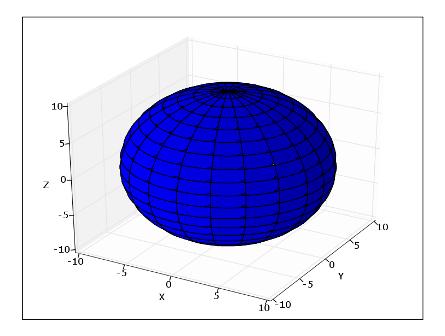
Surface (works on 0.87.5):
#!python
fig=p.figure()
ax = p3.Axes3D(fig)
# x, y, and z are 100x100 arrays
ax.plot_surface(x,y,z)
ax.set_xlabel('X')
ax.set_ylabel('Y')
ax.set_zlabel('Z')
p.show()

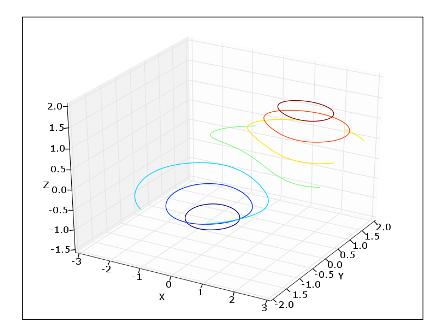
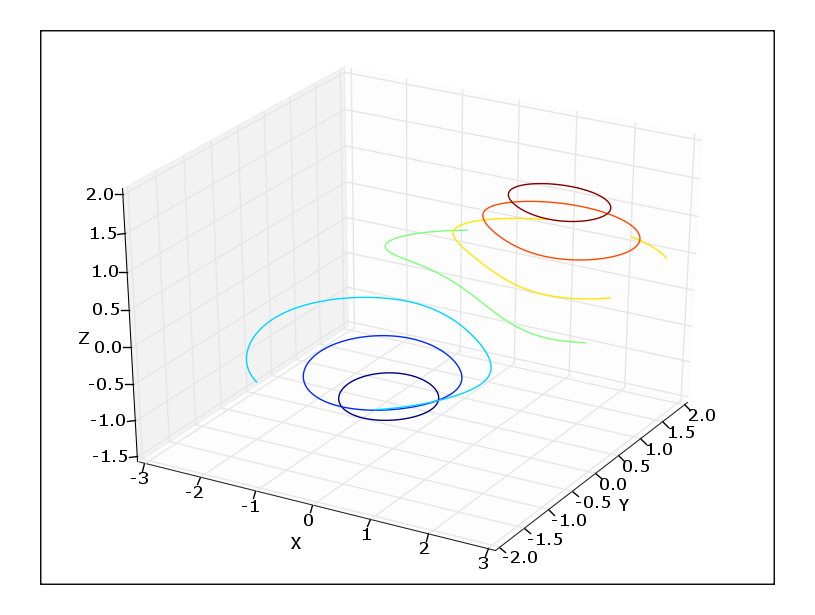
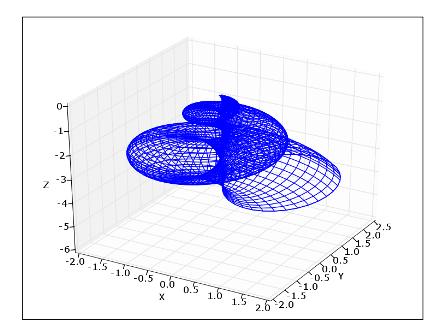
Contour3D (works on 0.87.5):
#!python
delta = 0.025
x = arange(-3.0, 3.0, delta)
y = arange(-2.0, 2.0, delta)
X, Y = p.meshgrid(x, y)
Z1 = p.bivariate_normal(X, Y, 1.0, 1.0, 0.0, 0.0)
Z2 = p.bivariate_normal(X, Y, 1.5, 0.5, 1, 1)
# difference of Gaussians
Z = 10.0 * (Z2 - Z1)
fig=p.figure()
ax = p3.Axes3D(fig)
ax.contour3D(X,Y,Z)
ax.set_xlabel('X')
ax.set_ylabel('Y')
ax.set_zlabel('Z')
p.show()

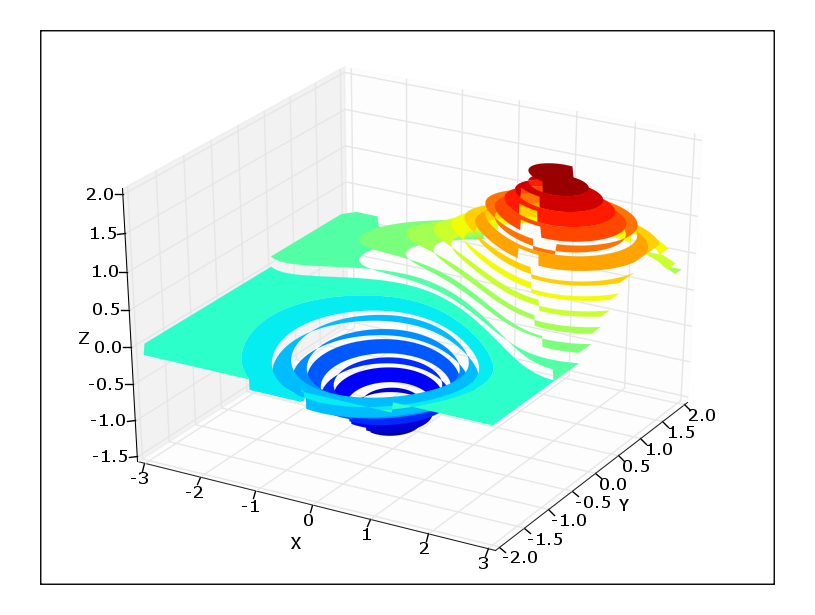
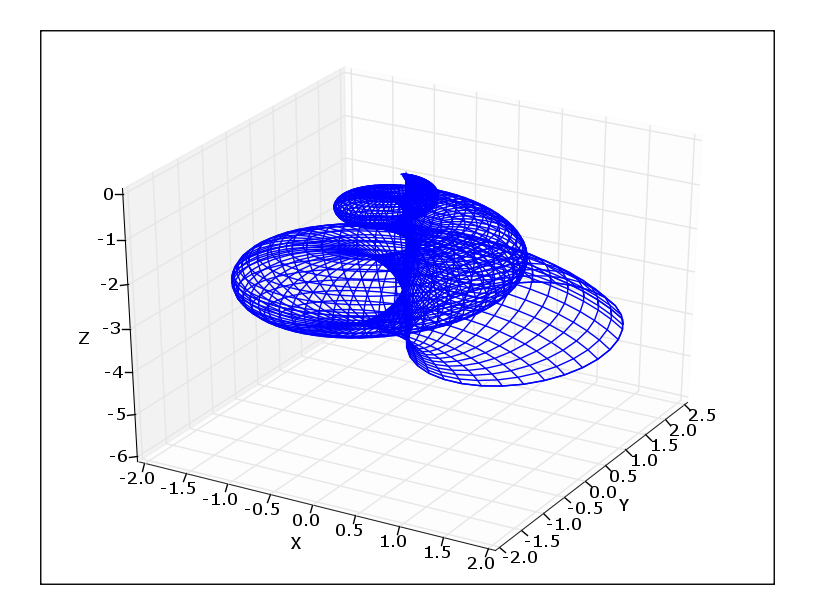
Contourf3D:
#!python
# in mplt3D change:
# levels, colls = self.contourf(X, Y, Z, 20)
# to:
# C = self.contourf(X, Y, Z, *args, **kwargs)
# levels, colls = (C.levels, C.collections)
fig=p.figure()
ax = p3.Axes3D(fig)
ax.contourf3D(X,Y,Z)
ax.set_xlabel('X')
ax.set_ylabel('Y')
ax.set_zlabel('Z')
fig.add_axes(ax)
p.show()

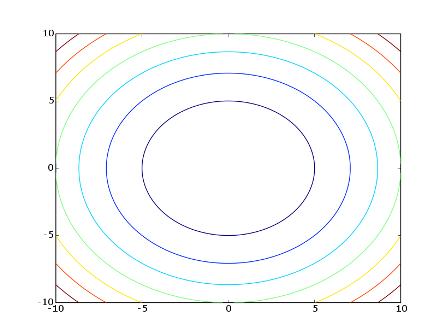
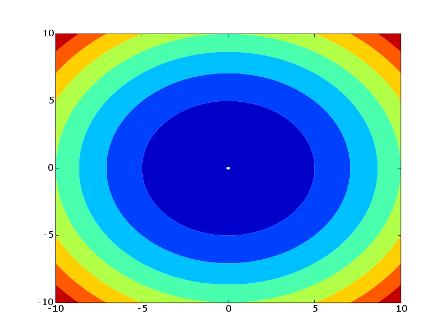
2D Contour Plots (work on 0.87.5):
#!python
x=r_[-10:10:100j]
y=r_[-10:10:100j]
z= add.outer(x*x, y*y)
### Contour plot of z = x**2 + y**2
p.contour(x,y,z)
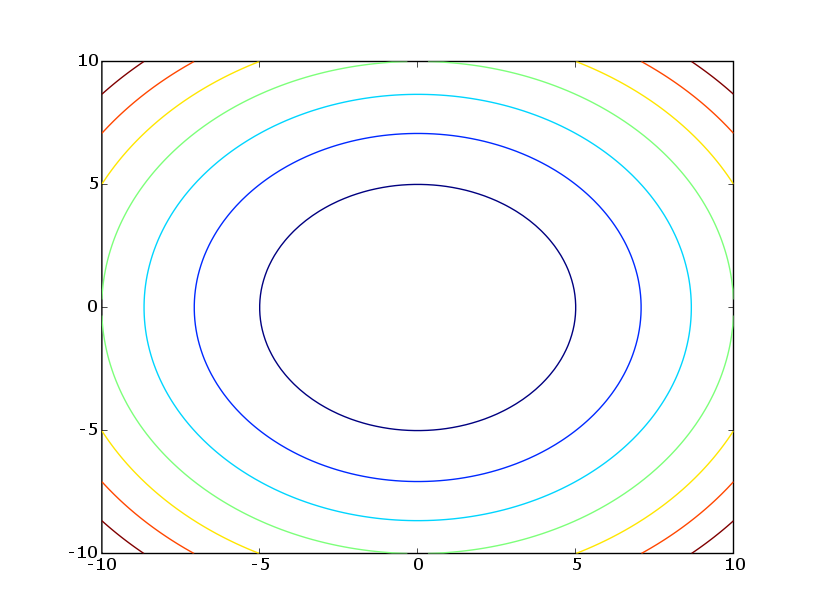
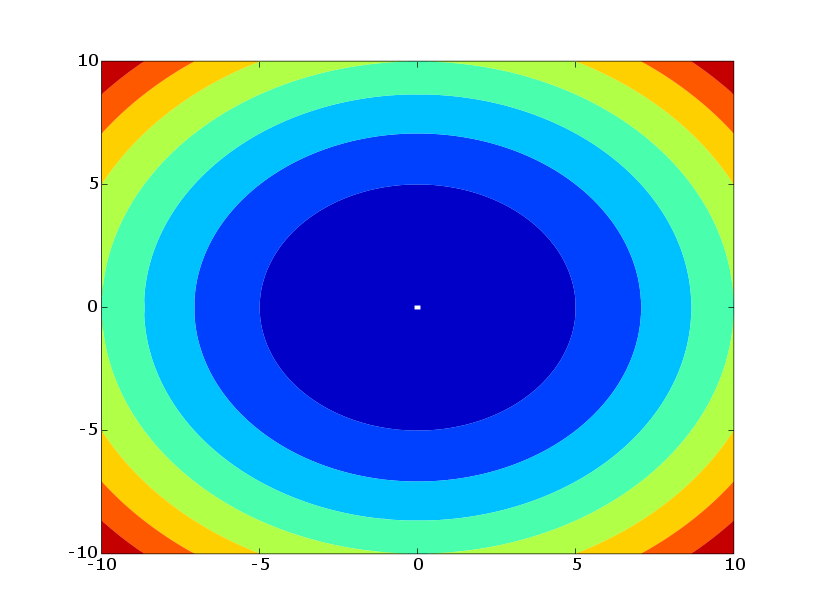
### ContourF plot of z = x**2 + y**2
p.figure()
p.contourf(x,y,z)
p.show()


For some other examples of 3d plotting capability, run the following commands. See the source of matplotlib/axes3d.py for more information:
#!python
# note that for the following to work you have to modify the test funcitons in your site-packages/matplotlib/axes3d.py like this:
#def test_xxxx():
#    import pylab
#    ax = Axes3D(pylab.figure())
#    ....
#    ....
#    pylab.show()
# the following then work on 0.87.5
p3.test_bar2D()
p3.test_contour()
p3.test_scatter()
p3.test_scatter2D()
p3.test_surface()
# the following fail on 0.87.5
p3.test_plot()
p3.test_polys()
p3.test_wir
Section author: Unknown[2], AndrewStraw, Unknown[9], Unknown[125], Unknown[123], Unknown[126], Unknown[83], GaelVaroquaux, Unknown[127], MartinSpacek
Attachments