Matplotlib: custom log labels
| Date: | 2008-09-17 (last modified), 2008-09-17 (created) |
|---|
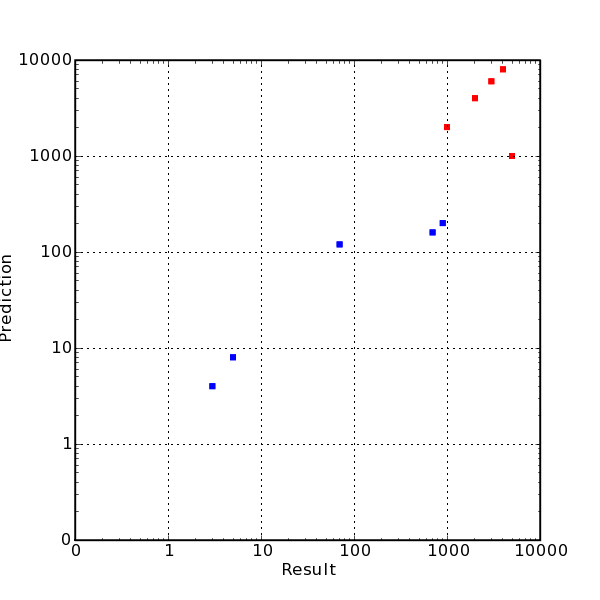
Example of how to replace the default log-plot exponential labels with integer labels. The same method will work for any kind of custom labeling. This example was pulled from the Python-list mailing list and the original can be found here.
In [1]:
from matplotlib.pyplot import *

def log_10_product(x, pos):
    """The two args are the value and tick position.
    Label ticks with the product of the exponentiation"""
    return '%1i' % (x)

# Axis scale must be set prior to declaring the Formatter
# If it is not the Formatter will use the default log labels for ticks.
ax = subplot(111)
ax.set_xscale('log')
ax.set_yscale('log')

formatter = FuncFormatter(log_10_product)
ax.xaxis.set_major_formatter(formatter)
ax.yaxis.set_major_formatter(formatter)

# Create some artificial data.
result1 = [3, 5, 70, 700, 900]
result2 = [1000, 2000, 3000, 4000, 5000]
predict1 = [4, 8, 120, 160, 200]
predict2 = [2000, 4000, 6000, 8000, 1000]

# Plot
ax.scatter(result1, predict1, s=40, c='b', marker='s', faceted=False)
ax.scatter(result2, predict2, s=40, c='r', marker='s', faceted=False)

ax.set_xlim(1e-1, 1e4)
ax.set_ylim(1e-1, 1e4)
grid(True)

xlabel(r"Result", fontsize = 12)
ylabel(r"Prediction", fontsize = 12)
Out[1]:

Section author: jesrl
Attachments