Linear regression
| Date: | 2018-03-12 (last modified), 2006-02-05 (created) |
|---|
Linear Regression Example
In [5]:
# IPython magic to plot interactively on the notebook
%matplotlib notebook
In [7]:
from scipy import linspace, polyval, polyfit, sqrt, stats, randn
from matplotlib.pyplot import plot, title, show, legend
# Linear regression example
# This is a very simple example of using two scipy tools
# for linear regression, polyfit and stats.linregress
# Sample data creation
# number of points
n = 50
t = linspace(-5,5,n)
# parameters
a = 0.8
b = -4
x = polyval([a, b], t)
# add some noise
xn = x + randn(n)
# Linear regressison -polyfit - polyfit can be used other orders polys
(ar, br) = polyfit(t, xn, 1)
xr = polyval([ar, br], t)
# compute the mean square error
err = sqrt(sum((xr - xn)**2)/n)
print('Linear regression using polyfit')
print('parameters: a=%.2f b=%.2f \nregression: a=%.2f b=%.2f, ms error= %.3f' % (a, b, ar, br, err))
print('\n')
# Linear regression using stats.linregress
(a_s, b_s, r, tt, stderr) = stats.linregress(t, xn)
print('Linear regression using stats.linregress')
print('parameters: a=%.2f b=%.2f \nregression: a=%.2f b=%.2f, std error= %.3f' % (a,b,a_s,b_s,stderr))
print('\n')
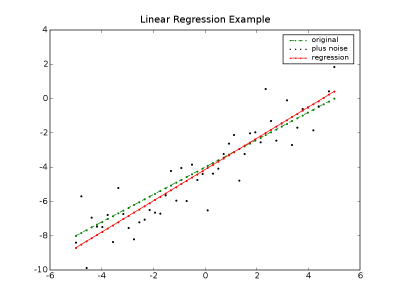
# matplotlib ploting
title('Linear Regression Example')
plot(t, x,'g.--')
plot(t, xn, 'k.')
plot(t, xr, 'r.-')
legend(['original','plus noise', 'regression'])
show();

Another example: using scipy (and R) to calculate Linear Regressions
In [ ]:
Section author: Unknown[1], Unknown[66], TimCera, Nicolas Guarin-Zapata
Attachments