Eye Diagram
| Date: | 2012-02-04 (last modified), 2012-02-04 (created) |
|---|
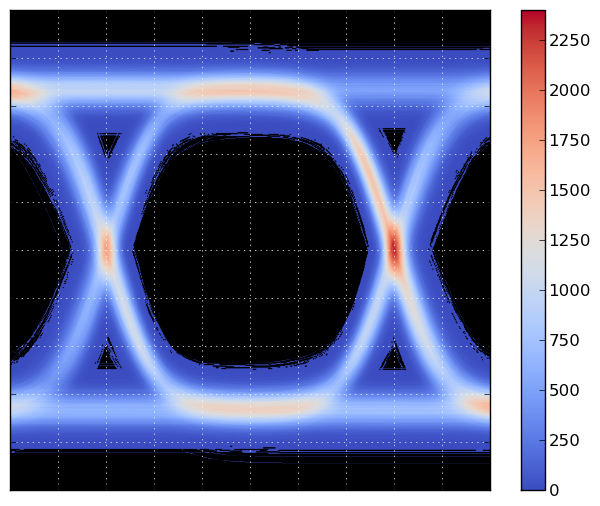
The code below generates the following plot:

The main script generates `num_traces` traces, and on a grid of 600x600, it counts the number times a trace crosses a grid point. The grid is then plotted using matplotlib's imshow() function. The counting is performed using Bresenham's line algorithm, to ensure that the counting is correct, and steep parts of the curve don't result in missed counts.
Bresenham's algorithm is slow in pure Python, so a Cython version is included. If you do not build the Cython version of the Bresenham code, be sure to reduce `num_traces` before running the program!
Here's the main demo script, eye_demo.py.
#!python
import numpy as np

use_fast = True
try:
    from brescount import bres_curve_count
except ImportError:
    print "The cython version of the curve counter is not available."
    use_fast = False


def bres_segment_count_slow(x0, y0, x1, y1, grid):
    """Bresenham's algorithm.

    The value of grid[x,y] is incremented for each x,y
    in the line from (x0,y0) up to but not including (x1, y1).
    """

    nrows, ncols = grid.shape

    dx = abs(x1 - x0)
    dy = abs(y1 - y0)

    sx = 0
    if x0 < x1:
        sx = 1
    else:
        sx = -1
    sy = 0
    if y0 < y1:
        sy = 1
    else:
        sy = -1

    err = dx - dy

    while True:
        # Note: this test is moved before setting
        # the value, so we don't set the last point.
        if x0 == x1 and y0 == y1:
            break

        if 0 <= x0 < nrows and 0 <= y0 < ncols:
            grid[x0, y0] += 1

        e2 = 2 * err
        if e2 > -dy:
            err -= dy
            x0 += sx
        if e2 < dx:
            err += dx
            y0 += sy

def bres_curve_count_slow(x, y, grid):
    for k in range(x.size - 1):
        x0 = x[k]
        y0 = y[k]
        x1 = x[k+1]
        y1 = y[k+1]
        bres_segment_count_slow(x0, y0, x1, y1, grid)


def random_trace(t):
    s = 2*(np.random.randint(0, 5) % 2) - 1
    r = 0.01 * np.random.randn()
    s += r
    a = 2.0 + 0.001 * np.random.randn()
    q = 2*(np.random.randint(0, 7) % 2) - 1
    t2 = t + q*(6 + 0.01*np.random.randn())
    t2 += 0.05*np.random.randn()*t
    y = a * (np.exp(s*t2) / (1 + np.exp(s*t2)) - 0.5) + 0.07*np.random.randn()
    return y


if __name__ == "__main__":
    import matplotlib.pyplot as plt
    grid_size = 600
    grid = np.zeros((grid_size, grid_size), dtype=np.int32)

    tmin = -10.0
    tmax = 10.0
    n = 81
    t = np.linspace(tmin, tmax, n)
    dt = (tmax - tmin) / (n - 1)

    ymin = -1.5
    ymax = 1.5

    num_traces = 1000

    for k in range(num_traces):

        # Add some noise to the times at which the signal
        # will be sampled.  Without this, all the samples occur
        # at the same times, and this produces an aliasing
        # effect in the resulting bin counts.
        # If n == grid_size, this can be dropped, and t2 = t
        # can be used instead. (Or, implement an antialiased
        # version of bres_curve_count.)
        steps = dt + np.sqrt(0.01 * dt) * np.random.randn(n)
        steps[0] = 0
        steps_sum = steps.cumsum()
        t2 = tmin + (tmax - tmin) * steps_sum / steps_sum[-1]

        td = (((t2 - tmin) / (tmax - tmin)) * grid_size).astype(np.int32)

        y = random_trace(t2)

        # Convert y to integers in the range [0,grid_size).
        yd = (((y - ymin) / (ymax - ymin)) * grid_size).astype(np.int32)

        if use_fast:
            bres_curve_count(td, yd, grid)
        else:
            bres_curve_count_slow(td, yd, grid)

    plt.figure()
    # Convert to float32 so we can use nan instead of 0.
    grid = grid.astype(np.float32)
    grid[grid==0] = np.nan
    plt.grid(color='w')
    plt.imshow(grid.T[::-1,:], extent=[0,1,0,1], cmap=plt.cm.coolwarm,
               interpolation='gaussian')
    ax = plt.gca()
    ax.set_axis_bgcolor('k')
    ax.set_xticks(np.linspace(0,1,11))
    ax.set_yticks(np.linspace(0,1,11))
    ax.set_xticklabels([])
    ax.set_yticklabels([])
    plt.colorbar()
    fig = plt.gcf()

    #plt.savefig("eye-diagram.png", bbox_inches='tight')
    plt.show()

Here's brescount.pyx, the Cython implementation of Bresenham's line algorithm:
#!python
import numpy as np
cimport numpy as np
cimport cython


@cython.boundscheck(False)
cdef int bres_segment_count(unsigned x0, unsigned y0,
                            unsigned x1, unsigned y1,
                            np.ndarray[np.int32_t, ndim=2] grid):
    """Bresenham's algorithm.

    See http://en.wikipedia.org/wiki/Bresenham%27s_line_algorithm
    """

    cdef unsigned nrows, ncols
    cdef int e2, sx, sy, err
    cdef int dx, dy

    nrows = grid.shape[0]
    ncols = grid.shape[1]

    if x1 > x0:
        dx = x1 - x0
    else:
        dx = x0 - x1
    if y1 > y0:
        dy = y1 - y0
    else:
        dy = y0 - y1

    sx = 0
    if x0 < x1:
        sx = 1
    else:
        sx = -1
    sy = 0
    if y0 < y1:
        sy = 1
    else:
        sy = -1

    err = dx - dy

    while True:
        # Note: this test occurs before increment the
        # grid value, so we don't count the last point.
        if x0 == x1 and y0 == y1:
            break

        if (x0 < nrows) and (y0 < ncols):
            grid[x0, y0] += 1

        e2 = 2 * err
        if e2 > -dy:
            err -= dy
            x0 += sx
        if e2 < dx:
            err += dx
            y0 += sy

    return 0


def bres_curve_count(np.ndarray[np.int32_t, ndim=1] x,
                     np.ndarray[np.int32_t, ndim=1] y,
                     np.ndarray[np.int32_t, ndim=2] grid):
    cdef unsigned k
    cdef int x0, y0, x1, y1

    for k in range(len(x)-1):
        x0 = x[k]
        y0 = y[k]
        x1 = x[k+1]
        y1 = y[k+1]
        bres_segment_count(x0, y0, x1, y1, grid)
    if 0 <= x1 < grid.shape[0] and 0 <= y1 < grid.shape[1]:
        grid[x1, y1] += 1
This file, setup.py, can be used to build the Cython extension module:
#!python
from distutils.core import setup
from distutils.extension import Extension
from Cython.Distutils import build_ext

import numpy

ext = Extension("brescount", ["brescount.pyx"],
    include_dirs = [numpy.get_include()])

setup(ext_modules=[ext],
      cmdclass = {'build_ext': build_ext})
To build the extension module, you must have Cython installed.
You can build the extension module as follows:
$ python setup.py build_ext --inplace
Section author: WarrenWeckesser
Attachments